

Market Strategy
by Talley Leger, Chief Market Strategist
September 18, 2026
Earnings Drive Stocks, Rates Make Noise
The short-term noise and handwringing about this week’s Federal Reserve (Fed) interest rate hike and rising bond yields (regression coefficient = -0.21) focuses on less important, albeit negative, determinants of stock prices. For long-term investors, the most important driver of share prices is earnings (regression coefficient = 0.96).
Fortunately, the US large company earnings “boom” is literally in uncharted territory! Indeed, S&P 500 trailing 12-month (TTM) operating earnings per share (EPS) soared 35% year-over-year (Y/Y) in 2Q26, a pace we’ve never enjoyed in the absence of a recession/recovery, low base, easy comparison and denominator effect.
“Four Horsemen” of the Earnings “Boom”
While forecasting exact trajectories in this unique environment is incredibly difficult, we can attempt to “triangulate” a possible outcome by blending macroeconomic momentum and microeconomic estimates with stylized “cycle-on-cycle” analysis.
Probing for “Peak” Earnings Growth, not “Peak” Earnings
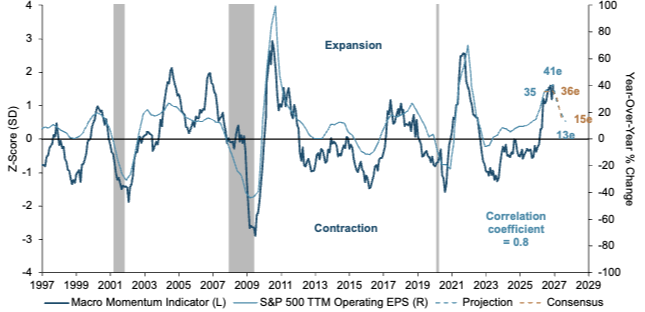
Sources: FactSet, FRED, S&P Global, WCG, 09/15/26. Notes: Vertical gray bands = US economic recessions. SD = Standard deviation. TTM = Trailing 12 month. EPS = Earnings per share. MMI = A composite of SK exports, the ISM Manufacturing Index, copper and global industrial materials prices. E = Estimate.
Having assessed about a dozen coincident to leading economic indicators, I created a new Macro Momentum Indicator (MMI) which has led S&P 500 TTM operating EPS growth by roughly six months. Using a z-score transformation, I “normalized” and combined the “first four movers,” which include South Korean (SK) export growth and the Institute for Supply Management (ISM) Manufacturing Index – planetary measures of technology and industrial demand – as well as copper and global industrial materials price changes – physical supply chain barometers (see the chart above).
Long-Term Signal Versus Short-Term Noise
My top-down MMI suggests a better-than-expected “peak” earnings growth rate of approximately 40%+ Y/Y (or $377) compared to the bottom-up analyst consensus estimate of 36% Y/Y (or $364):
- Harmonic Convergence: Coincidentally, ~40% Y/Y happens to be the average “peak” earnings growth rate across all business cycles, blending the extremes of both recessions/recoveries and expansions since 1990.
- Upside Risks: However, nothing about the current business cycle has been “average.” Despite intermittent shocks, surprisingly resilient nominal economic growth (6.6% Y/Y), stellar sales growth (15.6% Y/Y) and record margin expansion (17.0%) probably skew earnings risks to the upside, depending mostly on operating leverage, cost discipline and management execution.
Mosaic Theory
Based on currently available information, my basket of global leading indicators points to “maximum” earnings growth arriving in 4Q26. Coincidentally, bottom-up analysts also expect the earnings impulse to crest in the same quarter, meaning top-down macro and bottom-up micro models agree on the timeline.
For now, however, the four cylinders of the earnings engine are running hot:
SK Export Growth (69%) Is Ludicrous but Looking “Toppy”
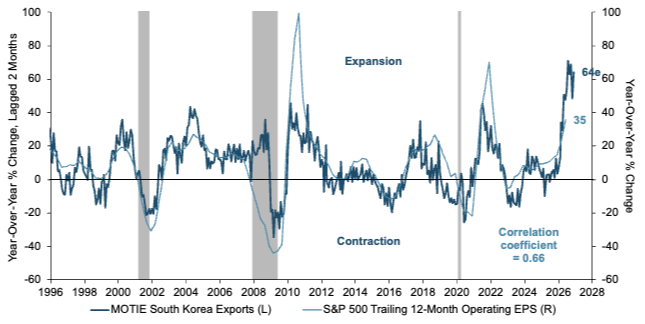
Sources: FactSet, FRED, S&P Global, WCG, 09/15/26. Notes: MOTIE = Ministry of Trade, Industry and Energy.
SK Export Growth – Ludicrous Speed
Importance: South Korea is a key bellwether for global trade, heavy industry, automotive production and technology / semiconductor supply chains. It’s also one of the first significant releases on the economic calendar each month, which allows us to assess world-wide demand ahead of month-end reports.
Signal: Monthly SK export growth, which “eased” to a ludicrous pace of 69% Y/Y in August from a recent top speed of 71% Y/Y in June, provides a 2-month lead on S&P 500 earnings growth with a strong positive correlation coefficient of 0.66. Global trade momentum confirms astonishing tech and industrial strength, which is unlikely to persist indefinitely (see the chart above).
ISM Manufacturing Index – Plenty of Gas in the Tank
Importance: The ISM is a composite index based on a monthly survey of purchasing and supply executives from over 400 manufacturing companies across the US. This widely followed report is also available on the first business day of each month.
Signal: The monthly ISM Manufacturing Index, which down ticked to a robust 54.6% in August from a nearby high of 55.6% in July, has a 4-month lead on S&P 500 earnings growth with a strong positive correlation coefficient of 0.68. Factory gate demand reflects a robust pipeline of activity (see the chart below).
Historically, the ISM (55%) Has Crested in the High 50s to Low 60s
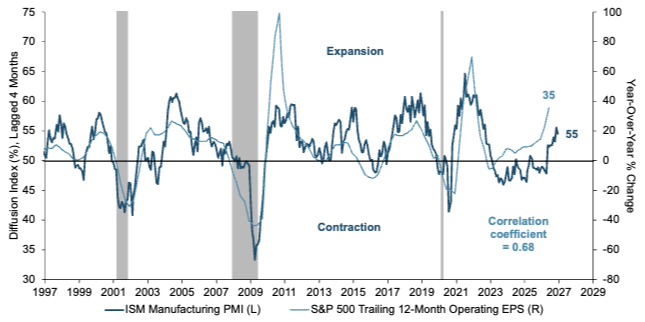
Sources: FactSet, FRED, S&P Global, WCG, 09/15/26.
Copper – Canary in a Chilean Mine
Importance: “Dr. Copper” is another early warning sign for global industrial production, construction, capital expenditures (capex) and supply chain activity. When real-time copper price changes begin to roll over, US large-cap earnings growth usually slows with a lag.
Signal: Copper price increases, which decelerated to 31% in September from a recent high of 46% in July, have a 5-month lead on S&P 500 earnings growth with a strong positive correlation coefficient of 0.64. Despite weather-related disruption, steady physical infrastructure and capex growth support the structural economic base beneath earnings and the stock market (see the chart below).
Global Industrial Materials – No Signs of Distress
Importance: The International Monetary Fund (IMF) Global Industrial Materials Price Index is a benchmark measure of raw manufacturing inputs, excluding energy and fuels. It focuses strictly on the primary industrial components of base metals (copper, aluminum, iron ore, tin, nickel, zinc, lead and uranium) and raw agricultural materials (timber, wool, cotton, hides and natural rubber).
Signal: Global industrial materials price gains, which cooled to 20% in July from a nearby high of 28% in May, sit at the top of the production line and have a 4-month lead on S&P 500 earnings growth with the strongest positive correlation coefficient of 0.74. Despite recent cooling, global raw input prices confirm a healthy underlying industrial pulse (see the chart below).
Copper Price Gains (31%) Are Elevated but Not Extreme
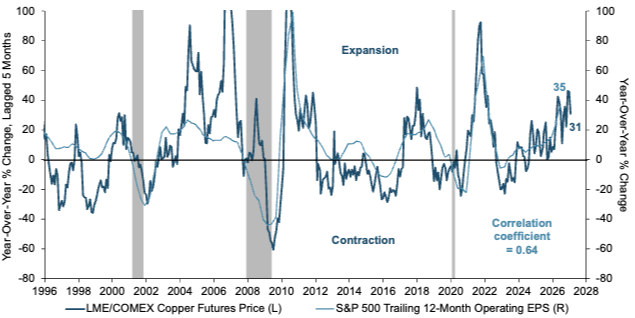
Sources: FactSet, FRED, S&P Global, WCG, 09/15/26. Notes: LME = London Metals Exchange. COMEX = Commodity Exchange.
Beyond a potential 4Q26 “peak,” my stylized “cycle-on-cycle” analysis suggests earnings may decelerate a bit more sharply than consensus anticipates, downshifting to a slightly worse-than-expected pace of 13% Y/Y (or $398) in 3Q27 compared to the bottom-up analyst estimate of 15% Y/Y (or $399).
Global Industrial Materials Price Increases (20%) Are Similarly Elevated but Not Extreme
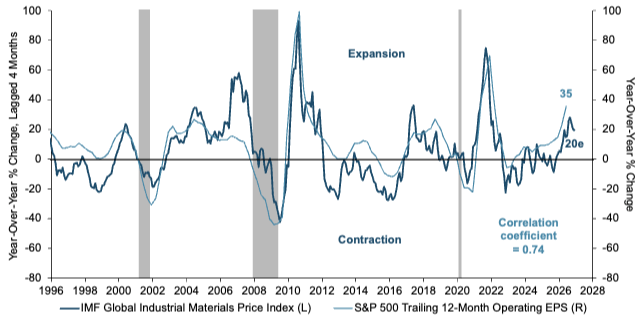
Sources:FactSet, FRED, S&P Global, WCG, 09/15/26. Notes:IMF = International Monetary Fund.
Earnings Engine – Downshifting, Not Stalling
To be clear, this isn’t a bearish change of view. Rather, it simply means that corporate profits should keep rising at a slower pace. The bottom line is that my projected 2027 “normalization” is largely a function of higher base effects and increasingly difficult comparisons next year.
Market Strategy Flash,S&P 500: The Tug of War Between Earnings & Interest Rates, August 21, 2026
Portfolio Strategy
by Jim Worden, CFA®, CMT®, CAIA®, Chief Investment Officer
September 18, 2026
Technology Angst
I barely remember, but our family once had a game called Pong1. The premise was super simple – hit the ball with the digital paddle as if in a game of ping pong. The graphics were practically nonexistent. The game objective was clear. Fast forward to Space Invaders and then to Nintendo and Super Mario Bros., then to PlayStation and Xbox, and the games got more engaging, had much better graphics, became more complex, and became more addictive.

Screenshot of Pong
We saw an evolution with cell phones and tablets. We saw massive numbers of users also join in social networks – Facebook, YouTube, Twitter, and Instagram. We witnessed some problems get solved – finding a friend across the world on Facebook after more than 30 years – and other problems get created – phone addiction, mental health struggles, decreased social interaction, etc. We still find solutions and we still find ourselves with additional challenges.
ChatGPT 3.5 came out on November 30, 2022, and it felt revolutionary2. Looking back not quite four years later, the entire world has changed as a result of artificial intelligence (AI). We are now on ChatGPT-6 and there are many other models, both frontier and open free models3.
Some of the largest companies by market value are now either directly or indirectly related to AI hardware, AI software models, or data centers4. Trillions of dollars will likely be spent on software, hardware, infrastructure, and energy generation related to AI5.
The models have gotten much better, but also more complex. Many problems have been solved and new ones have emerged. This pattern is true for AI as it has been for other technologies6.
With all this change has come increased anxiety about job security, privacy, national security, and what the future will look like. It’s been a mixture of excitement about possibilities – the potential to cure diseases and solve complex problems, autonomous vehicles, brain implants that will allow the paralyzed to walk again, helper robots – but also much anxiety and angst.
The angst seemed to come to a new head in the last week. Several leaders of AI companies publicly stated that we need to slow the pace of AI development and deployment7. An Anthropic researcher reportedly estimated that there was a greater than 10% chance that AI could see humans go extinct within the next decade8. At the same time, other leaders in government and at AI hardware companies said there’s no reason to slow things down7,9.
There’s complexity to the issue and risks are not one-sided:
- Increased supervision and regulation could protect society, but it could also protect the profits of the leading frontier companies and stifle competition.
- A slowdown could allow the Chinese-backed AI models to catch up and be on a level playing field with the US models.
- A slowdown in innovation and development may encourage engineers to leave the US and move to where there is no measured pacing.
- Not slowing the development and deployment could mean loss of control of AI agents and models that find ways around rules.
- Not slowing down could introduce newer cyber threats that consumers, businesses, and local, state, and federal governments are not prepared to handle.
- Not slowing the pace might mean that we run out of energy capacity to support the innovative growth.
These are all possibilities. Nothing is certain. There’s no easy answer. And that’s okay. Our country is endowed with a number of extremely talented individuals from all walks of life. Some are in government. Some in business. Some are engineers. Others are in finance or economics. Others in math. Many are working in technology to solve problems we may not even know about. As we have always done, we will work the problem or problems and try to come up with solutions. We will likely make mistakes along the way, but we will most likely figure it all out. It will take time. We have figured it out before and we will likely do the same here again. We found a way to go to the Moon when it seemed impossible. We found ways to inoculate ourselves from harmful diseases. We found a way to make cars drive themselves. We found a way to make computers model things and reason and help solve problems. We figured out how to get qubits to behave a certain way and advance quantum computing.
I am confident that we will use some of these new tools to also figure out the best ways to reduce the risks or protect against them. That may mean hardening cybersecurity and building more rules for models or model agents. Or it may mean coming out with better and safer designs that enhance both innovation and safety and privacy and national security.
As someone who uses some of the most advanced AI models on a regular basis, I am confident that we will work through many of these challenges and develop better solutions. It won’t happen overnight and it may be messy, but I believe we will figure it out.
Footnotes
- Pong. The Strong National Museum of Play describes Atari’s 1972 arcade game and the home version introduced in 1975. https://www.museumofplay.org/games/pong/
- ChatGPT launch. OpenAI introduced ChatGPT on November 30, 2022, based on a model in the GPT-3.5 series.
- Model terminology. OpenAI identifies GPT-6 Astra as a model; ChatGPT is the product. Its gpt-oss release provides an example of open-weight models distributed under Apache 2.0. Open weights do not make hardware, electricity, hosting, or every use free.
- Market value and AI exposure. Per Bloomberg data as of 9/16/26, NVIDIA, Apple, Microsoft, Amazon.com, Alphabet, Broadcom, Meta Platforms, Micron Technology, Tesla, Advanced Micro Devices, and Intel are in the top 20 companies in the S&P 500 by market cap and represent 40.07% of the index.
- Investment scale. McKinsey projects $5.2 trillion in AI-related data-center capital requirements through 2030 under its central scenario, including equipment, infrastructure, and power. This is projected investment needed, not confirmed spending already incurred, and does not substantiate the draft’s full software-spending scope. Separately, the IEA reports approximately $500 billion of global data-center investment in 2024, including non-AI uses. https://www.mckinsey.com/industries/technology-media-and-telecommunications/our-insights/the-cost-of-compute-a-7-trillion-dollar-race-to-scale-data-centers https://www.iea.org/reports/energy-and-ai/executive-summary
- Benefits and risks. NIST’s AI Risk Management Framework addresses risks to individuals, organizations, and society. https://www.nist.gov/itl/ai-risk-management-framework. Electricity solved problems – reduced darkness, improved safety, enabled long-distance communications – but created other challenges such as environmental damage, safety hazards, and power dependency. Automobiles solved urban pollution, increased travel speed, and connected rural communities but increased traffic fatalities, created air pollution, and led to massive traffic jams.
- AI pacing debate. Amodei, Altman, and Musk called for a slowdown; Huang opposed deceleration. Trump called it a “hoax.” Source: Danielle Abril, September 15, 2026. https://www.theguardian.com/technology/2026/sep/15/anthropic-nvidia-ceos-ai
- Extinction estimate. September 10 reporting attributes to Anthropic researcher Evan Hubinger a personal estimate of greater than 10% within the next decade. This is a personal, subjective judgment about future AI, not an established statistical probability or consensus. This citation is secondary reporting of an interview. https://nypost.com/2026/09/10/tech/anthropic-researcher-jacob-coxon-who-quit-ai-role-over-fears-of-racing-into-extinction-says-people-are-begging-for-regulation/
- Government opposition to new regulation. Reuters reports David Sacks’s opposition to additional AI regulation on September 16, 2026, while supporting developer responsibility for product safety. Opposition to regulation should not be equated with a claim that safeguards are unnecessary. For the hardware-company position, see note 7. https://www.reuters.com/legal/litigation/trump-adviser-sacks-says-ai-fears-driven-by-fear-mongering-playbook-2026-09-16/
Definitions
Artificial intelligence (AI): Machine-based systems that infer from inputs how to generate outputs such as predictions, content, recommendations, or decisions.
AI model: A computational system trained on data to perform tasks such as generating text, recognizing patterns, or making predictions.
Frontier AI model: A model near the leading edge of current capabilities. There is no single universally accepted threshold.
Open-weight model: A model whose trained numerical parameters are available for download under a license. This does not necessarily include training data or all development code, or imply unrestricted or cost-free use.
AI agent: A system that uses an AI model and tools to take actions toward a goal, with varying levels of autonomy and human oversight.
Data center: A facility housing computing, storage, and networking equipment, together with power and cooling systems.
Market capitalization: The market value of a public company’s outstanding shares, generally calculated as share price multiplied by shares outstanding.
Cybersecurity: Measures used to protect systems, networks, and information from unauthorized access, disruption, or damage.
AI development and deployment: Development involves building, training, and testing systems; deployment makes them available for real-world use. Safeguards can apply differently to each stage.
S&P 500: A stock market index tracking the performance of 500 of the largest publicly traded companies in the United States. It serves as a primary benchmark for the overall health of the U.S. stock market.
Operating EPS: A company’s net profit from regular business operations divided by its outstanding shares, excluding one-time gains or losses. It shows how much profit a company generates from its core everyday business.
NBER Recession: A significant decline in economic activity spread across the economy, lasting more than a few months, as officially designated by the National Bureau of Economic Research. It is determined by analyzing factors like gross domestic product, income and employment.
Correlation Coefficient: A standardized numerical measure, ranging from -1 to +1, that quantifies the strength and direction of a linear relationship between two variables. A value close to zero indicates no linear relationship, while values near the extremes indicate strong positive or negative relationships.
Standard Deviation: A statistical measure that quantifies how much the data points in a set vary or spread out from their average (mean). A low standard deviation means the data points are closely clustered around the average, while a high standard deviation indicates that the data are spread across a wider range of values.
Z-Score Transformation: A statistical process that converts a raw data point into a standardized score by subtracting the dataset mean and dividing by the standard deviation. This transformation indicates how many standard deviations a specific data point lies above or below the average.
Diffusion Index: An economic or survey metric that measures the proportion of components within a group that are experiencing positive growth or expansion over a given period. It typically oscillates around a baseline of 50%, where values above 50% indicate widespread expansion and values below indicate contraction.
Disclosures
The views expressed are the author’s opinions as of September 16, 2026, and may change without notice. This material is for general informational and educational purposes and is not individualized investment advice or a recommendation to buy or sell any security or adopt any investment strategy.
Statements about future technological capabilities, spending, regulation, economic effects, and risk mitigation are forward-looking and uncertain. Actual outcomes may differ materially. Third-party forecasts and subjective probability estimates are not guarantees and do not necessarily represent the views of the author or the firm. Sources believed to be reliable have been used, but their accuracy and completeness are not guaranteed.
Investing involves risk, including possible loss of principal. Technological progress and industry growth do not assure profitable investments. Technology-related businesses may face rapid obsolescence, competition, regulatory changes, cybersecurity threats, infrastructure constraints, and substantial capital requirements. References to companies and products are illustrative and do not constitute endorsements or recommendations.
The views expressed are for informational and educational purposes only and are subject to change without notice.
This material is not intended as, and should not be interpreted as, individualized investment advice or a recommendation to buy, sell, or hold any security, sector, industry, or investment strategy.
References to specific companies, securities, sectors, or industries are for illustrative purposes only and should not be construed as investment recommendations.
Investing involves risk, including the possible loss of principal. Investments in a specific industry or sector may involve greater risk and volatility than more diversified investments.
Past performance is not indicative of future results. No investment strategy can guarantee a profit or protect against loss.
Forward-looking statements, including views about future demand, pricing, supply, or industry cycles, are based on current expectations and assumptions and are subject to risks and uncertainties. Actual results may differ materially.
Data and information are believed to be reliable, but accuracy, completeness, and timeliness are not guaranteed. Source documents should be retained for factual claims, third-party research references, and company-specific data.
Portfolio holdings, allocations, and risk budgets are subject to change based on market conditions, client objectives, and investment guidelines.
The author, firm, clients, or related persons may hold positions in securities mentioned and may buy or sell those securities without notice, subject to applicable policies and regulations.
Securities offered through LPL Financial, Member FINRA/SIPC. Investment Advice offered through WCG Wealth Advisors, LLC, an SEC Registered Investment Advisor. WCG Wealth Advisors, LLC and The Wealth Consulting Group are separate entities from LPL Financial. Index performance is shown for illustrative purposes only and does not predict or depict the performance of any investment. Past performance does not guarantee future results.
All information in this report is believed to be from reliable sources; however, WCG Wealth Advisors, LLC, makes no representation as to its completeness or accuracy.
In general, stock values fluctuate, sometimes widely, in response to activities specific to the companies as well as broad market, economic and political conditions. Stock investing involves risks, including fluctuating prices and loss of principal. Value investments can perform differently from the market as a whole. They can remain undervalued by the market for long periods of time. (135-LPL) International investing involves special risks such as currency fluctuation and political instability and may not be suitable for all investors. These risks are often heightened for investments in emerging markets. (93-LPL)
The fast price swings in commodities will result in significant volatility in an investor’s holdings. Commodities include increased risks, such as political, economic, and currency instability, and may not be suitable for all investors. (122-LPL)
Rebalancing a portfolio may cause investors to incur tax liabilities and/or transaction costs and does not assure a profit or protect against a loss. (28-LPL)
There is no guarantee that a diversified portfolio will enhance overall returns or outperform a non-diversified portfolio. Diversification does not protect against market risk. (26-LPL)
Standard deviation is a historical measure of the variability of returns relative to the average annual return. If a portfolio has a high standard deviation, its returns have been volatile. A low standard deviation indicates returns have been less volatile. (131-LPL)
This is for educational / general purposes only, does not constitute investment, tax or legal advice and should not be relied on as such. This is not to be construed as an offer to buy or sell any financial instruments. Any strategies discussed are not intended to be relied upon as the sole factor in making an investment decision for any individual. As with all investments there are associated inherent risks. Please obtain and review all financial material carefully before investing. All material presented is compiled from sources believed to be reliable and current, but accuracy cannot be guaranteed. The opinions voiced in this material are for general information only and are not intended to provide specific advice or recommendations for any individual. All performance referenced is historical and is no guarantee of future results. All indices are unmanaged and may not be invested in directly. These comments should not be construed as recommendations but as an illustration of broader themes.
Forward-looking statements are not guarantees of future results. They involve risks, uncertainties and assumptions; there can be no assurance that actual results will not differ materially from expectations. In addition, forward-looking statements, including index targets or market scenarios, are hypothetical in nature, reflect current views and assumptions and are subject to change based on market and economic conditions and are not guarantees of future performance. This is a hypothetical example and is not representative of any specific investment. Your results may vary. (88-LPL) Scenario outcomes are illustrative and not predictive. This does not constitute a recommendation of any investment strategy or product for a particular investor. Investors should consult a financial professional before making any investment decisions.
The S&P 500 is a stock market index tracking the stock performance of 500 of the largest companies listed on stock exchanges in the United States. Indexes are unmanaged and cannot be invested in directly. (102-LPL)
Government bonds and Treasury bills are guaranteed by the US government as to the timely payment of principal and interest and, if held to maturity, offer a fixed rate of return and fixed principal value.
Publication Date: September 18, 202
For Public Use in the US
The Wealth Consulting Group
LPL 1177519